
The median age is 28.1, while the worldwide average is 31.4. The worldwide average GDP per capita is $17,062, while South Africa’s is $12,096. We already know that South Africans spend more time per day (10h46m) on the internet than any other country in the world (worldwide average is 6h58m). So, what are they doing on the internet?
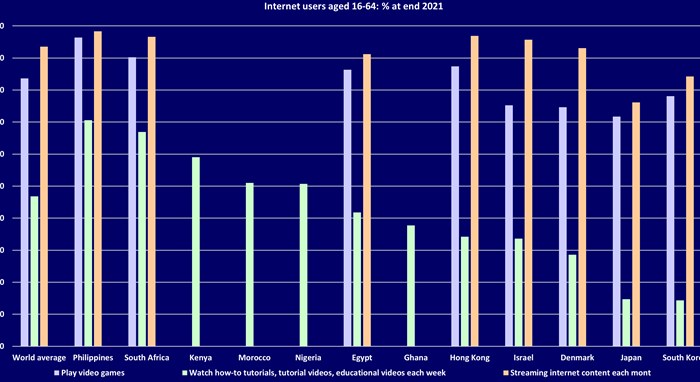
The graph shows what South Africans are doing on the internet compared to what is being done in other countries in Africa and around the world.
While the detailed country datasets included in the report show only a few selected countries each time, all the data on the African countries were extracted, together with data for a few other countries around the world, to draw a good comparison on a few selected metrics, where South Africa is ahead of the worldwide average.
The year-on-year growth is in two areas: social media and gaming, both up 1.4%. Watching TV and reading press media are both down year-on-year, 2% and 1.6%, respectively.
| Global internet users (aged 16-64) are using the internet to: |
| Watch TV for 3h20m: -2% year-on-year (YoY) |
| Use social media for 2h27m: +1.4% YoY |
| Read press media for 2h00m: -1.6% YoY |
| Listen to radio for 1h01m: unchanged YoY |
| Game for 1h12m - +1.4% YoY |
This is the global data (average 6h58m per day), but of course there are wide variations per country in terms of what people are doing on the internet, because there are wide variations in terms of time spent on the internet every day, for example Philippines is at 10h27m, while Japan is at 4h26m.
| Main reasons for using the internet: |
| Find information - 61% |
| Stay in touch with friends/family - 55.2% |
| Keep up-to-date with news/events - 53.1% |
| Watch videos/TV shows/movies – 51.5% |
| Research how to do things - 51.3% |
| Finding new ideas or inspiration – 47.5% |
| Accessing and listening to music – 45.8% |
| Researching products and brands - 45.8% |
| Filling up spare time and general browsing – 42.7% |
| Researching places, vacations, and travel – 37.6% |
| Researching health issues and healthcare products – 35.8% |
| Managing finances and savings – 34.6% |
| Gaming – 31.8% |
| Business-related research – 30.8 |
| Meeting new people – 30.5 |
The top websites visited, and apps used, are chat and messaging, social networks, and search engines or web portal. These three are a long way in front of the others.
| Top website and apps |
| Chat and messaging – 95.6% |
| Social networks – 95.2% |
| Search engines or web portal – 83.6% |
| Shopping, auctions or classifieds - 58.1% |
| Maps, parking or location-based services – 56.9% |
| Email - 50.4% |
| Music - 46.9% |
| News – 42.3% |
| Weather – 41.9% |
| Entertainment – 40.5% |
| Games - 34.8% |
| Food, recipes, restaurants or takeaways - 32.6% |
| Taxi, ride sharing, bike or scooter hire - 29.5% |
| Banking, investing or insurance - 28.3% |
| Sports – 27.3% |
*% of internet users aged 16-64
(Source: All data was extracted from the annual data reports published by Hootsuite / WeAreSocial / DataReportal on the data as at end 2021 (https://datareportal.com/reports/digital-2020-global-digital-overview).