An investor who is placed in a product that fails to meet their expectations is sure to be unhappy and likely to want to switch out of it when the product provides surprises on the downside.
Chart 1 below shows the rolling 12-month total returns of the FTSE/JSE All Share Index (with dividends re-invested) between 1 June 1996 and 30 September 2015. Each dot on the graph represents a return for the index for the preceding year. The blue line shows what inflation was for the corresponding period and the red line shows the average annualised return. The dotted lines are one standard deviation above and below the average.
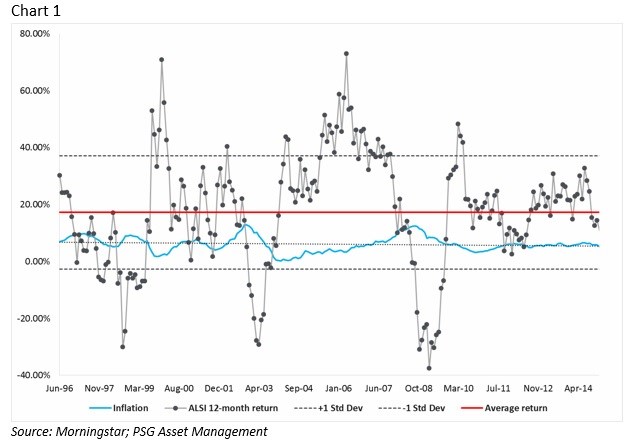
• The average 12-month return for the index was 17.24%. Inflation for the period averaged 6.05%.
• The average real (net of inflation) return for the full period was 11.19%.
• The highest positive 12-month return was 73% for the period ended 30 April 2006.
• The highest negative 12-month return was -37.59% for the period ended 28 February 2009.
• The annualised standard deviation (variability) of these returns was 19.9%.
• Nearly 70% of the time returns fell within one standard deviation of the average - between 37.11% and -2.63%.
• 15.5% of the time the returns were more than one standard deviation above the average (above 37.11%)
• 14.7% of the time returns were more than one standard deviation below the average (below -2.63%).
• In just 13 out of 232 periods, the return for the respective 12-month period was between within 2% of the average (about 5.6% of the time).
So what we can see from this data is that while the average annual return was 17.24, this occurred very infrequently. The reason for this is that the stocks which have made up this index over this period have been very volatile - as evidenced by a high standard deviation of nearly 20%.
When it comes to the more volatile asset classes - like equities - the variability of returns can be significant. The higher the volatility, the lower the probability that short-term returns will be near to average returns.

Consider, for instance, the returns of a particular 232 rolling periods to measure (monthly returns from 1 June 1996 to 30 September 2015). It was a very short snapshot of returns, looking at a period in which real returns have been very strong relative to what has been experienced over the long term. The data shows the long-term returns for four asset classes in South Africa: equity, listed property, bonds and cash.
If we compare the real return for equities going back to 1925 we see that this asset class has given a real return of around 8% - well in excess of the more conservative asset classes - and has also displayed the greatest variability of returns.
It's all very well knowing what the average returns are that one can expect over the long term from investing in various products. However, it is also very important to know and understand - and be comfortable with - the variability of those returns over the shorter term. As we have seen above, whilst equities have given us the best average returns over time, average is not normal. In fact, these returns can be quite some distance away from average.