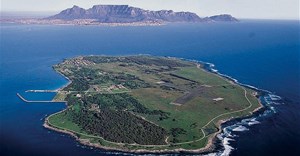


Released in April 2022 by the Department of Forestry Fisheries and the Environment (DFFE), the South African National Biodiversity Institute (Sanbi) and Nelson Mandela University, it follows the expansion in 2019 of the South African Marine Protected Area (MPA) network to 41 MPAs encompassing 5.4% of its mainland waters. The hope is that South Africa will soon shift its MPA footprint to 10%.
The CBA Map informs protection and management and pulls the marine biodiversity sector’s strategy into one place in a visual way. The primary purpose of this process is to ensure that marine life and ecological infrastructure are protected, as well as to make sure that the oceans economy is implemented in a sustainable manner.
The creation of this map is a very collaborative and data hungry process, produced by including datasets in a computer model with data submissions from all sectors around South Africa including government, NGOs, and private enterprises with 976 biodiversity features and design elements included.
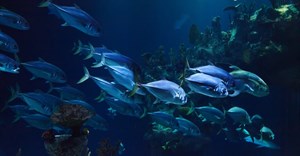
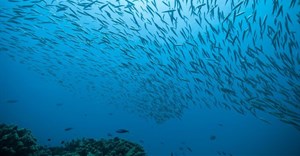
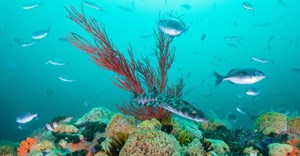
The map highlights ecosystem types; important areas and distributions of species such as turtles, seabirds, whales, seals, sharks, and rays; unique or special habitats or features; ecological processes; ecological infrastructure and existing priority areas for protection.
Design elements include edge matching and aligning priority areas both locally and internationally, culturally important areas, ecological condition, and climate change adaptation. In addition, the dataset includes cost layers which are areas to be avoided to reduce conflict (around 19 different sectors including fisheries, aquaculture, petroleum, mining, and transport) and considerations linked to cumulative impact of past and current activities.
“This means that the CBA Map is the most effective way to protect our biodiversity while reducing conflict with industry,” says Kendyl Wright, MPA scientist at Wildtrust.
This version of the CBA Map has identified areas of important biodiversity and zones them to include critical biodiversity areas (natural (18%) and restore (3.6%)) which must be either maintained or restored to a natural or near natural state, and ecological support areas (6.6%), which must be kept in a functional state.
These areas, together with the 5.4% MPAs identify 33.6% of our ocean space around South Africa as biodiversity prioritisation areas and inform MPA expansion in the future. These areas are also assigned management recommendations which are outlined in the sea use guidelines.
“Within our existing MPA network of 5.4%, South Africa’s coastal zone is well represented, with just under 37% of the coast falling within MPAs,” says Wright.
“While there are still critical coastal areas, it is offshore regions that comprise those low hanging fruit in the potential ‘next 5% MPAs’ where the benefits to the people of South Africa significantly outweigh the immediate costs.
"These include key areas identified during the Phakisa and CBA Map process but left unprotected on the west coast such as an expanded area around the Orange Shelf MPA. It is certainly clear that the science and planning groundwork to achieve spatial protection targets has been done, and that we are ready to take the next step in our journey to achieve 10% protection of our mainland waters,” says Wright.
South Africa finalised V1.2 of its CBA Map in April, although this is an iterative process with updates likely as data improves. This indicates key areas that require protection, and the prediction is that much of this 'next 5% MPAs' will be offshore where the value to the people of South Africa through carbon sequestration, food security and oxygen provision far outweigh any negatives.
This means that South Africa is poised and ready to achieve 10% of our ocean in MPAs and this will go a long way to contributing our lions share towards the global 30x30 goal – referred to as the 30% before 2030 goal at the United Nations Ocean Conference which took place last month in Portugal.
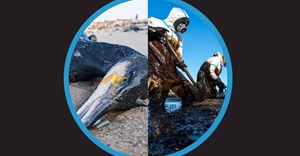
“Over-fishing, damaging industrial activities, habitat destruction, resource extraction, climate change and pollution are not letting up and by not protecting our oceans’ ability to keep giving what we take, we risk a biodiversity crisis, and a subsequent ocean collapse and economic catastrophe,” comments Wright.