


Sections
The SAARF AMPS and SAARF RAMS 2003B adult (16 years and older) population estimate has not changed from that used for 2003A. It remained at 29,773 million. The combined January to June and July to December 2003 sample, on which the SAARF AMPS and SAARF RAMS 2003B reports are based, is 25 114. It represents fieldwork for the calendar year 2003.
Basic literacy (can read and understand at least one language) remained static at 92,6%. However, functional literacy (primary school completed) has increased from 79,5% a year ago to 81,0%. Average household income has also gone up during the same period from R3 956 to R4 296, which is in real terms 2,7% above the inflation rate (CPI). It seems as if unemployment is leveling off at about 33%.
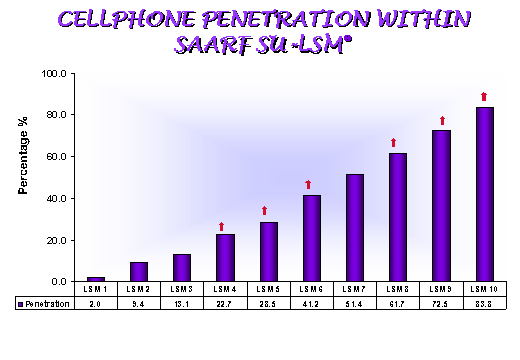
With the exception of cell phone ownership, no significant changes in access to services occurred. Cell phone ownership has increased from 24,1% a year ago to 30,8%, an increase of 6,7%. This growth was mainly in the prepaid sector and is significant in six groups, as is evident from the arrows pointing upwards.
Purchasing of lottery tickets is continuing to trend downward in total, as is evident in the lower and middle LSM Groups (LSM 1 to 6) and in LSM 9. However, increased purchasing occurs for the remaining upper groups, LSM 7, 8 and 10.

DVD is the only durable item in home that showed a significant growth (from 2,5% penetration a year ago to 5,4%)
Daily newspaper readership at the 'any' daily level has gone up significantly, due to a growth in readership mainly in Gauteng, also in the 35-49 age group and LSM 5-6. Daily Sun is the only title in this group that showed a significant growth. With a penetration of 5,9% (1,755m readers), it is now close to Sowetan, the largest daily at 6,2% (1,853m readers) and it has already become the largest daily in Gauteng.
Weekly newspaper readership remained stable overall, but readership of weeklies increased significantly in the Western Cape and particularly in Cape Town. As opposed to an increase in daily newspaper readership in the middle LSM groups (5-6), the growth in weekly readership is in the top LSMs (9-10) at the 'any' weekly level. Sunday Sun and Soccer Laduma showed significant growth, while the Citizen Weekend Edition decreased, mainly due to a decrease in Johannesburg.
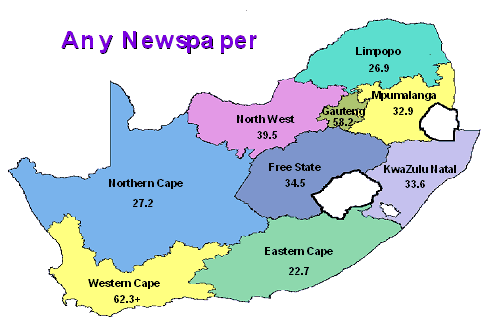
It is interesting to note the differences in newspaper readership by province. The Western Cape is by far the leader with 62,3% of the adults in this province who read at least one newspaper, while the Eastern Cape represents the other end with 22.7% of their population reading one or more newspapers. See map below.
The + behind the Western Cape figure means that it increased significantly since AMPS 2002B.
Click here for detailed newspaper readership figures on www.saarf.co.za.
Magazine readership by province reflects a different picture, where the Western Cape and Limpopo represent the two opposing ends of the spectrum, as is evident from the map below.

Despite the fact that magazine readership reflects a very stable picture, the readership of one or more women's interest, men's interest, sport and home/garden magazines are all still growing. This reflects a very healthy trend.
With the exception of weekly newspapers and subscriber magazines, there are slight increases in the average number of titles read.
As far as individual titles are concerned, a stable picture emerges. Only Club Magazine (Lewis/Best), Fairlady and Y Magazine increased significantly, while Bona, Imagine/Droom and Pace showed significant decreases. Other significant movements within sub-groups can be obtained from the PowerPoint slides that are included.
Click here for detailed magazine readership figures on www.saarf.co.za.
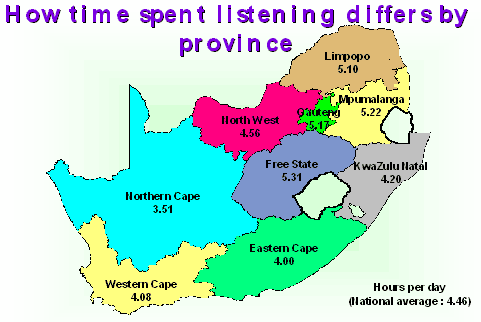
The time spent listening to radio has increased from 3 hours 54 minutes in 2002 to 4 hours 46 minutes per day in 2003. This is the first full 12-month period that we collected radio only information, and also since we deleted 'place of listening'. This will, at least in part, have contributed to this increase. The increase in listening time was mainly from midday to midnight. There are also large differences in listening time by province, with the Free State on top of the list with 5 hours 31 minutes, and Northern Cape at the other end with 3 hours 51 minutes.
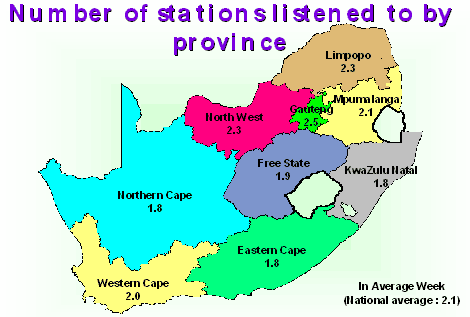
The number of stations listened to by province also differs, as is evident from the map below.
Radio listening by station at both the past 7 day and average Monday - Friday levels reflects a very healthy picture. Many stations show a significant year on year increases at both the above levels. However, at a national level, the largest increases in listening occurred on Saturdays and Sundays.
The only station that showed a decrease in its 7-day listenership is Munghana Lonene FM. No station decreased at the average Monday to Friday level.
Click here for detailed radio listenership figures on www.saarf.co.za.
The time spent viewing television in the TAMS Panel has remained static at about 3 hours per day.
This was the last time that television viewing will be included in RAMS. Despite the fact that the daily total TV patronage has remained the same, the stations viewed have changed. The number of people that support e-tv is continuing to grow, while the other stations, excluding SABC 3 and DStv are on a downward trend. This supports the TAMS trends.
Click here for detailed television viewership figures on www.saarf.co.za.
Cinema shows a very stable picture, at the 4-week rolling average, 14 and 7 day levels. However, there is a slight upward trend but not significant at this stage. The only significant increase occurred in Cape Town.
Click here for detailed cinema viewership figures on www.saarf.co.za.
With the exception of contact with train advertising, which is on a downward trend, all the other outdoor advertising types are on an upward trend. This growth is significant for taxis, trailers and trucks. The latter might also reflect economic growth and might be due to more movements of trucks rather than the population.
Nearly half of the adult population 13,317m (44,7%) is using a minibus/taxi on a 7-day basis, while private car is in second place with 12,056m (40,5%). These numbers are much lower for buses (2,678m or 9,0%) and trains (914 000 or 3,1%)
Click
SAARF
Piet Smit or
Mluleki Ncube
Tel: (011) 463-5340

